If you’re like most of the small business owners, marketers and entrepreneurs I meet, you’ve heard of Google Analytics and know it’s a web statistics program. Maybe it’s installed on your website, but you aren’t sure how to access the powerful data it provides.
If you’re like most of the small business owners, marketers and entrepreneurs I meet, you’ve heard of Google Analytics and know it’s a web statistics program. Maybe it’s installed on your website, but you aren’t sure how to access the powerful data it provides.
Don’t let another month go by without checking your website’s pulse through Google Analytics. You’ll learn valuable insights on your visitors and content, so you can make better, more informed marketing decisions.
For example, Google Analytics offers small businesses a concrete way to determine whether social media channels like Facebook, Twitter, LinkedIn or YouTube are creating engagement and driving website traffic and sales. Wouldn’t you like to know if your social media efforts are paying off?
Google Analytics can also provide insights into the biggest driver of online activity: mobile. With the accelerated adoption of smart phones and tablets, it’s increasingly important that your website content displays well on mobile devices.
Every small business owner should review these “Big 6” Google Analytics Reports at least monthly. They’ll help you make more targeted marketing decisions!
1. Audience Overview: Provides a quick overview of your website’s performance for a chosen period (graphic below shows 2012 vs 2013). You’ll learn how many unique people visited your site, the number of pages they viewed, and the bounce rate (percentage who viewed only one page before exiting). This is the default report and opens when you log-in.

2. New vs. Returning: Businesses need to attract repeat and new customers. This report shows the ratio of new vs. returning visitors, which will help determine how well your external and online marketing efforts are doing at engaging first-time visitors and enticing them to come back. This report is under the tab Audience / Behavior / New vs Returning.

3. Mobile Device: This report tells what percentage of site visits are from mobile devices or tablets, including the brand and model. As stated in my recent blog, “129 Million Reasons Your Business Needs to Go Mobile,” over 37 million Americans use only mobile devices to access the Internet. This huge shift emphasizes the importance of this report. It can help you decide when to invest in a dedicated mobile site design, or build a new, responsive website that automatically adjusts content for mobile. This report is under the tab Audience / Mobile / Devices.

4. Geographic Map: Understanding where your web traffic originates can provide insight into the performance of specific offices, outside sales reps, ad campaigns, events and more. This report allows you to view website visits by continent, country and city. It’s good to know where visitors are coming from, but seeing where they aren’t coming can tell you where to focus future marketing efforts and dollars. This report is under the tab Audience Geo / Location.

5. Pages: This report is great for understanding the most and least popular pages on your site, with the average time spent and the bounce rate. If the bounce rate is high, or the time on the page is low, you might consider redesigning the page to be more engaging, or to make sure the content is relevant to the page title. This report is under the tab Behavior / Site Content / All Pages (Choose Page Title as Primary Dimension to see the pages by name, instead or url).

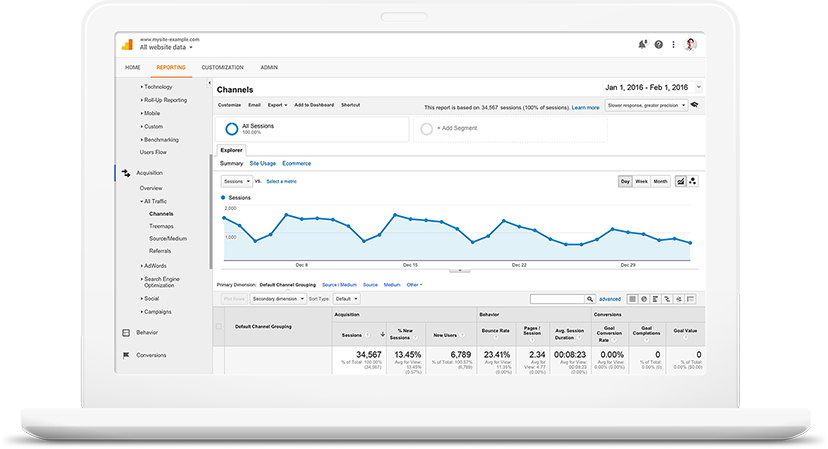
6. All / Referral Traffic: With this report, you’ll see which websites are referring traffic to your site and how much traffic they’re referring. For example, you’ll know whether Facebook, LinkedIn, Yelp, Google, Bing, industry blog or paid ads are generating more traffic. You may discover advertising, partnerships, or free press opportunities by contacting referring sites that are catering to the same customer base you’re trying to reach. This report is under the tab Acquisition / All Traffic.

With these 6 essential Google Analytics reports, you’ll know without a doubt if a banner ad boosted website traffic, an email marketing campaign increased a product’s page views, or if you need to congratulate your Portland sales staff for generating so many sign-ups for the upcoming webinar.
You’ll be amazed at the insight you’ll gain and how valuable the information will be in helping you make smarter marketing decisions.
And if you become obsessed with your newfound knowledge, you can go really deep into the metrics of Google Analytics. For most busy small business owners, marketers and entrepreneurs, these “Big 6” reports will provide a great roadmap to improving your user’s online experience and your bottom line.
Not sure if you have Google Analytics installed already, or want to get started? Check with your web designer or developer, IT department, or contact Gary at garyt@onmerit.com, or (425) 654-1814 x106 to get started.
About the Author
Gary is OnMerit Marketing’s owner and blog writer. A Brand Designer and Internet Marketing Specialist, he has a passion for helping small businesses look great and grow their businesses online. Follow Gary on Twitter @onmerit, or Facebook: www.facebook.com/onmeritmarketing


